Dec 17th, 2019
Version 12.0 offers new chart functionality
The 3 chart highlights include:
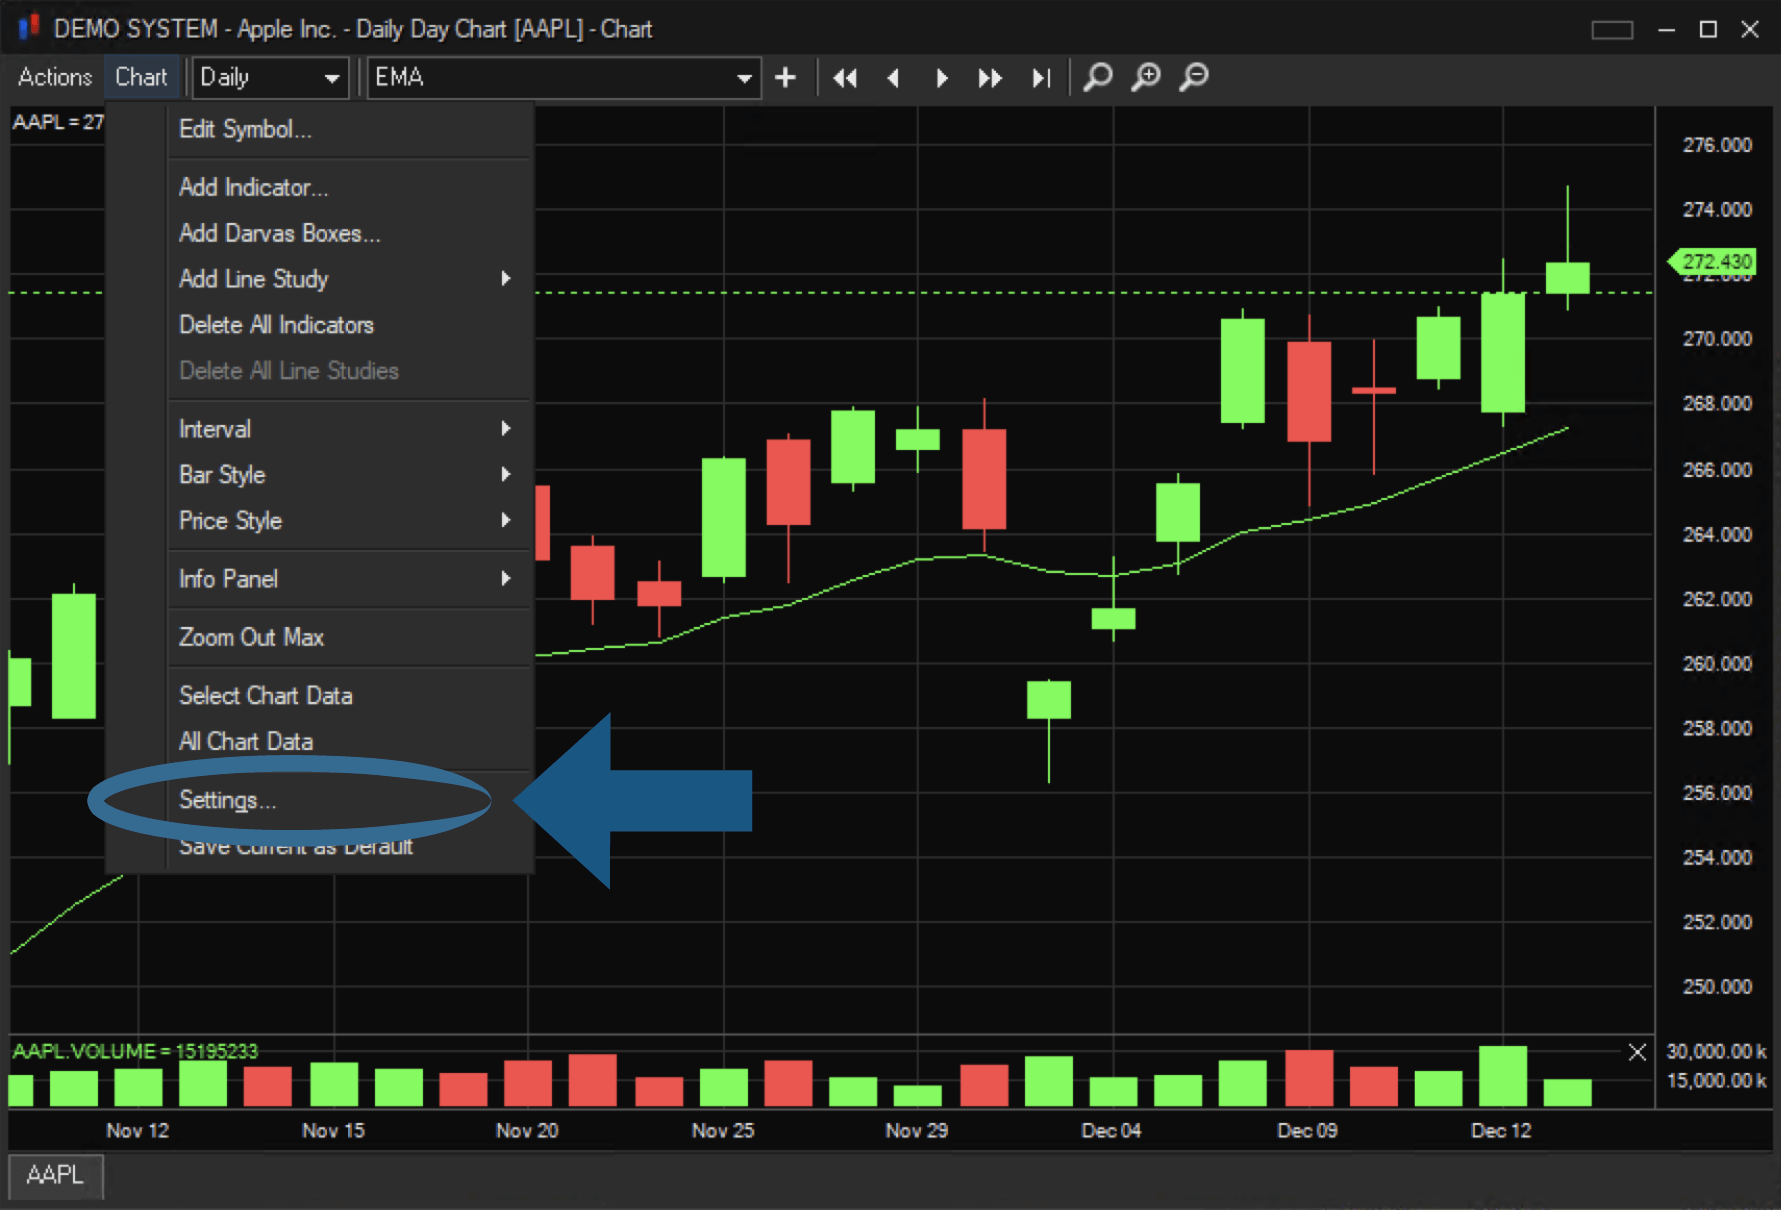
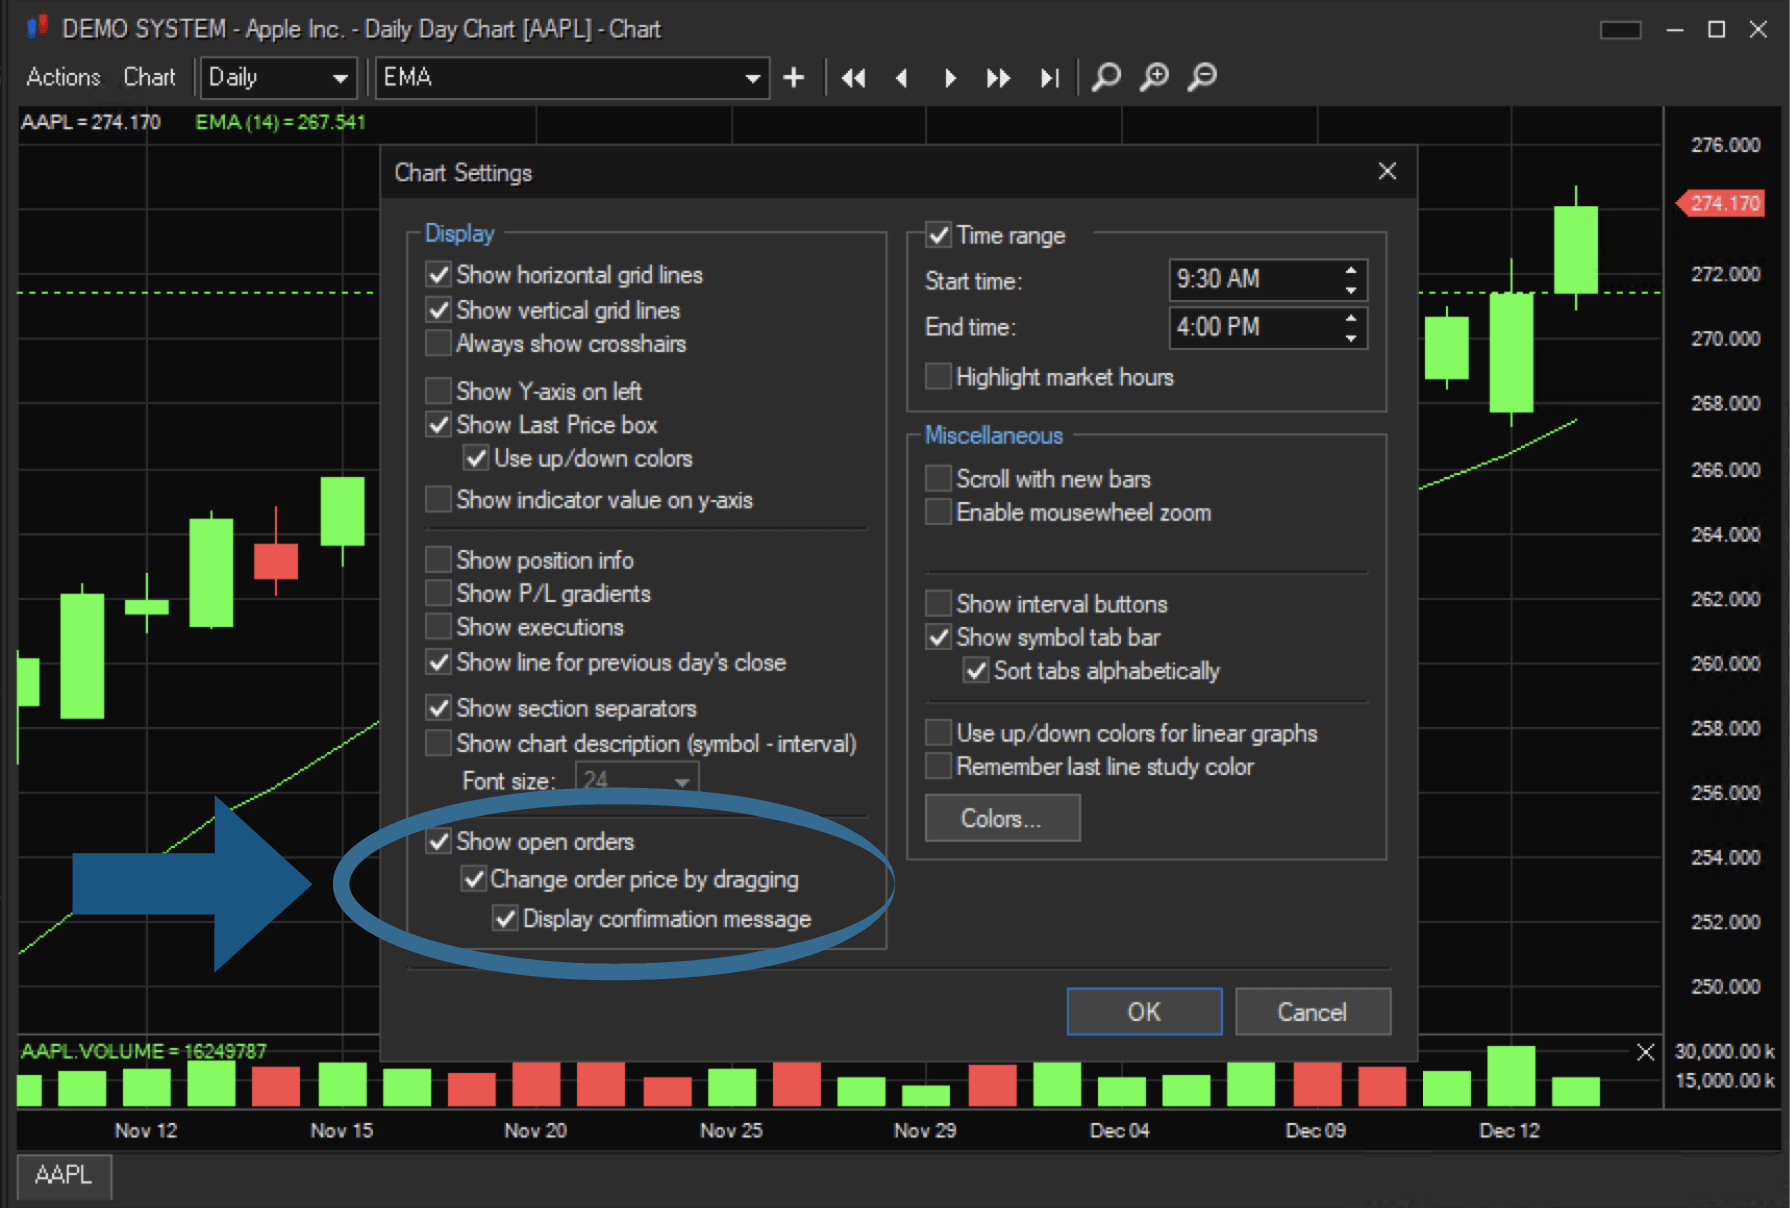
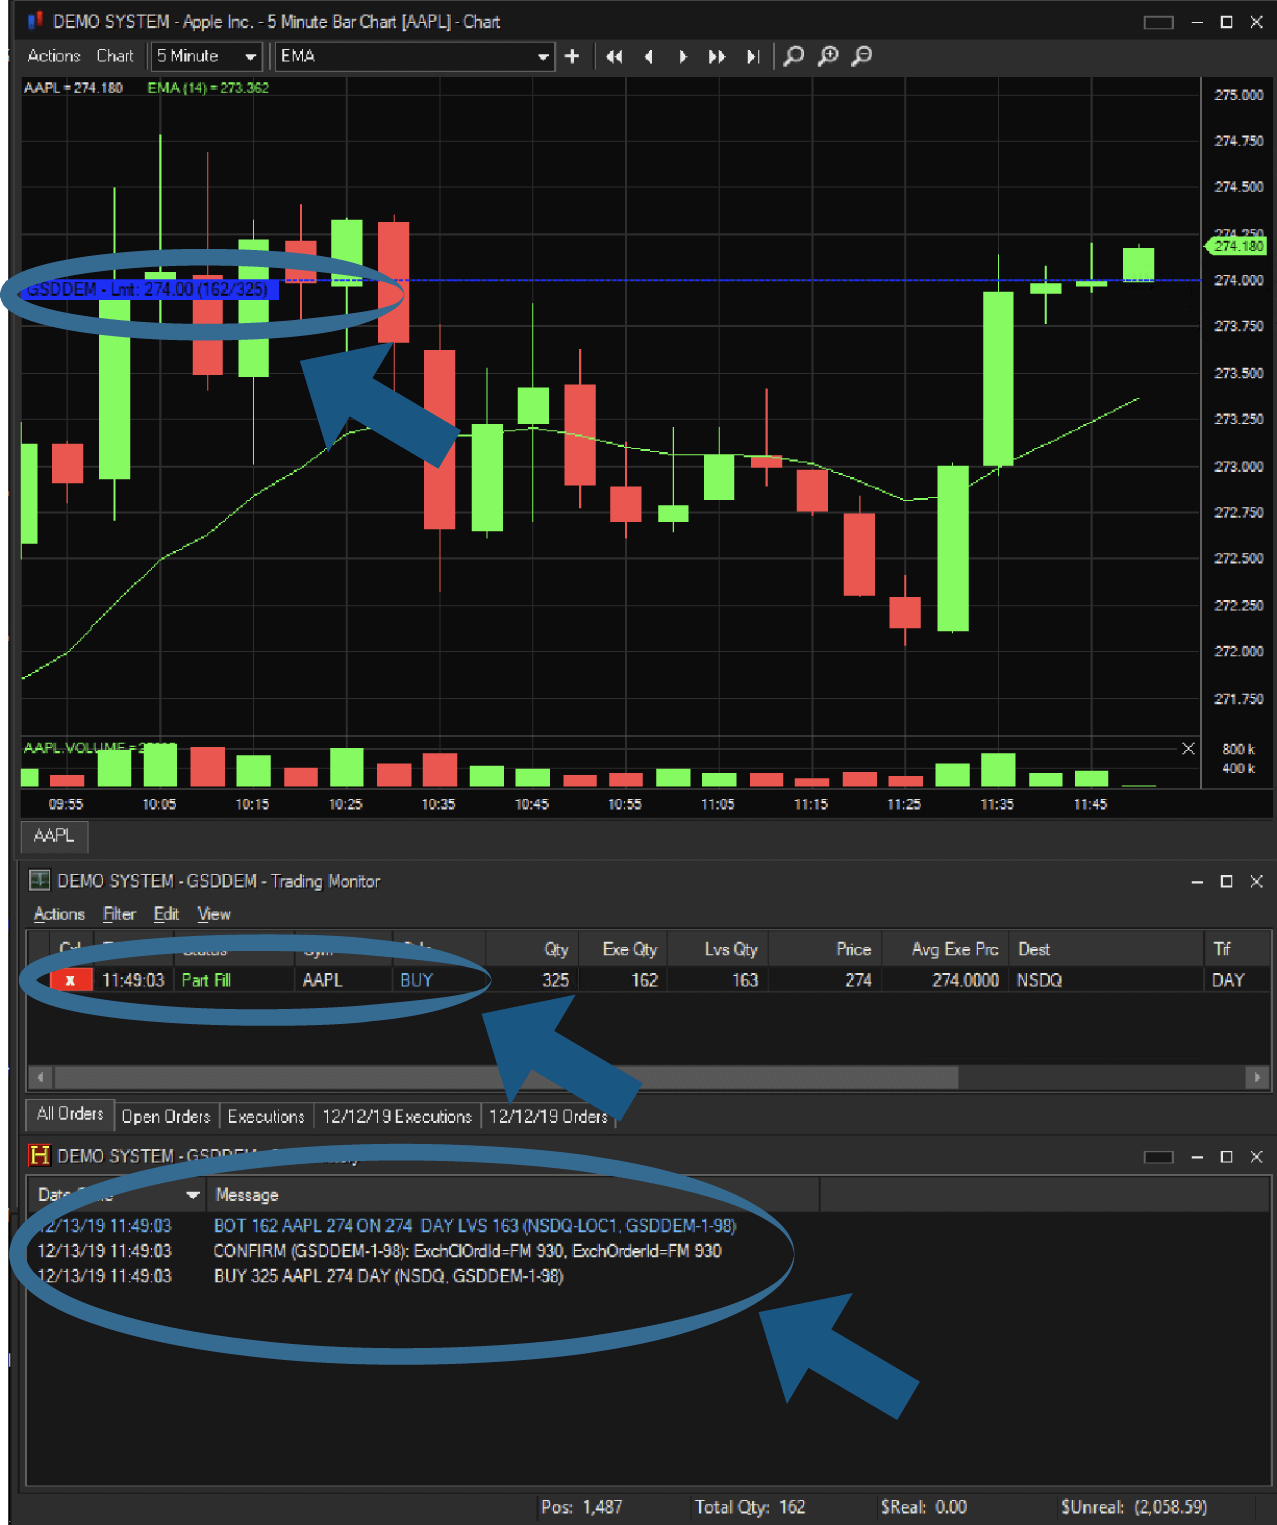
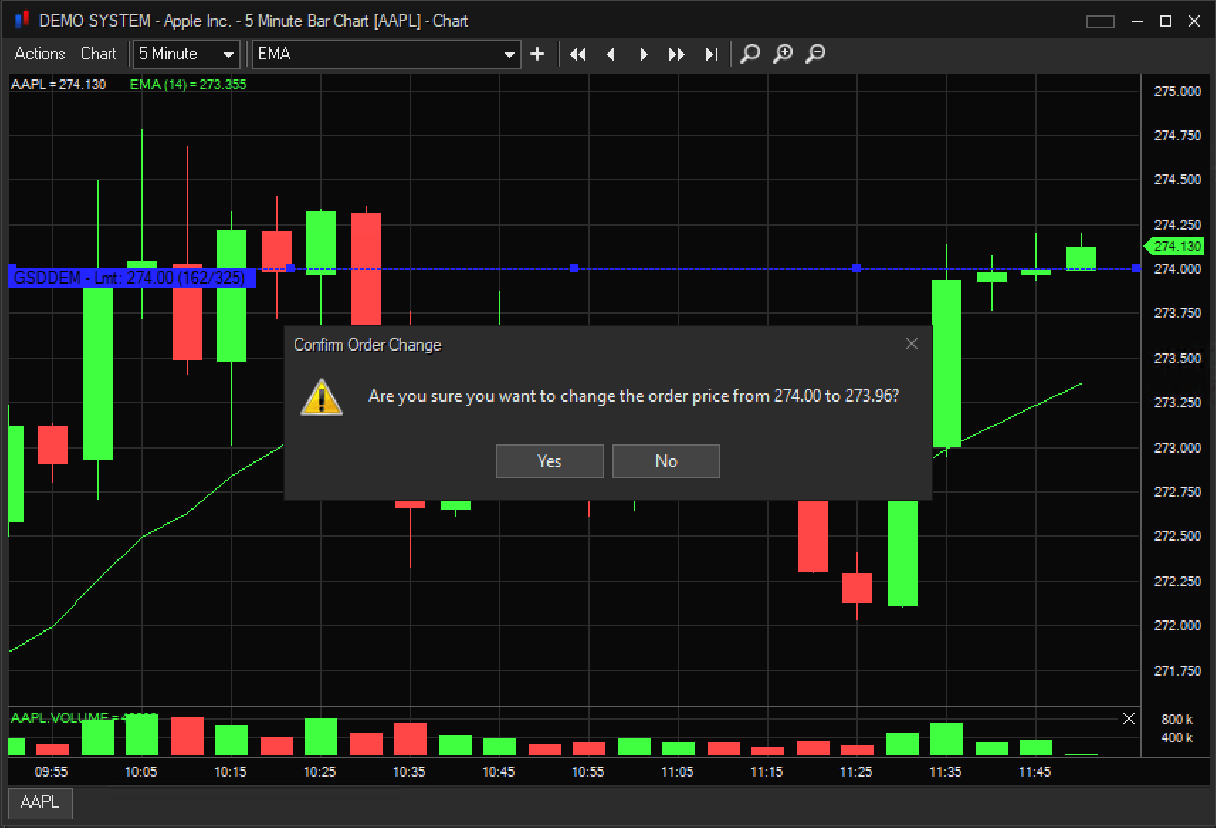
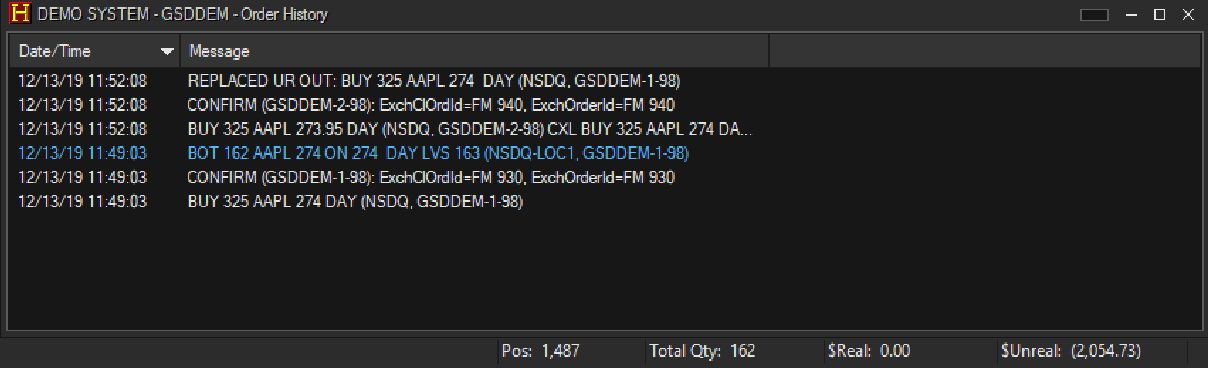
The Open Order shows in the Trading Monitor and as a blue line in the Chart Window.
To modify the order, click and drag the line, and click YES to accept.
The accepted change will appear in your Order History.
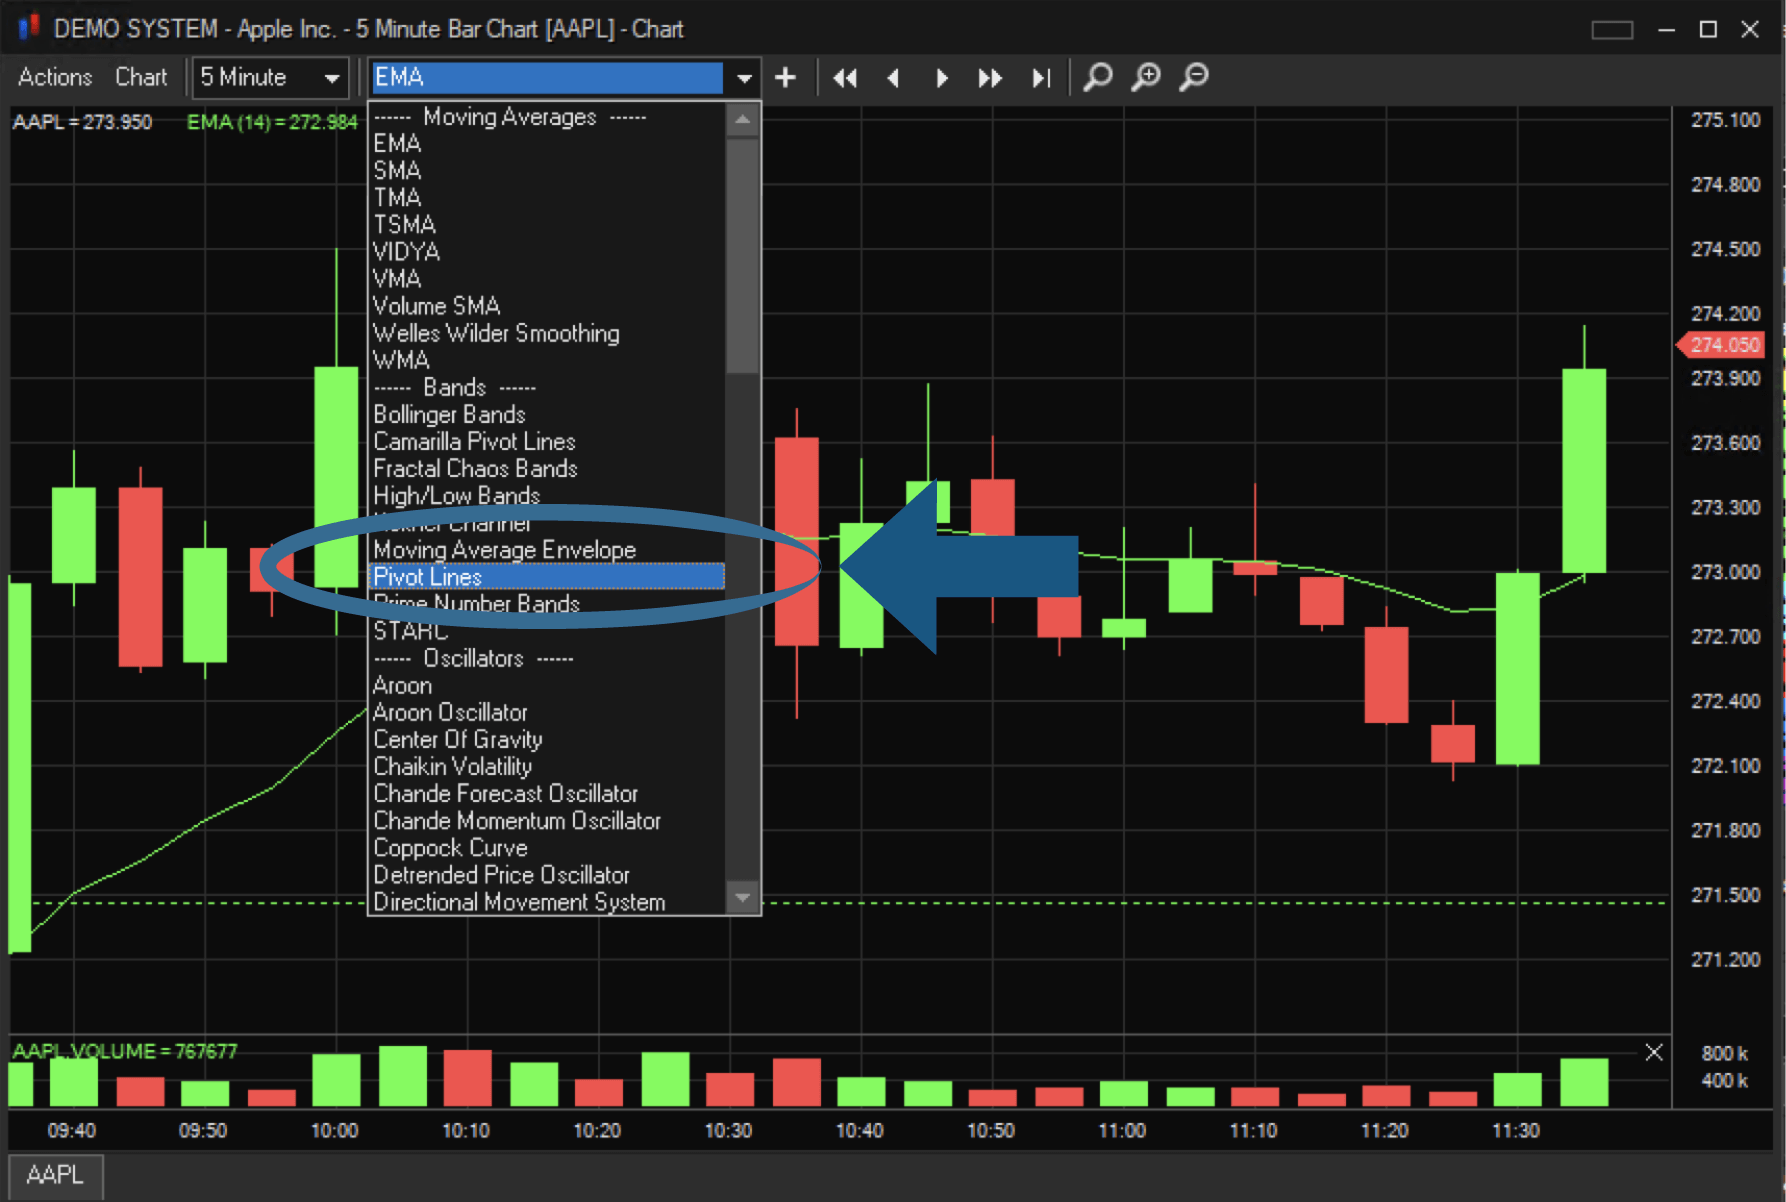
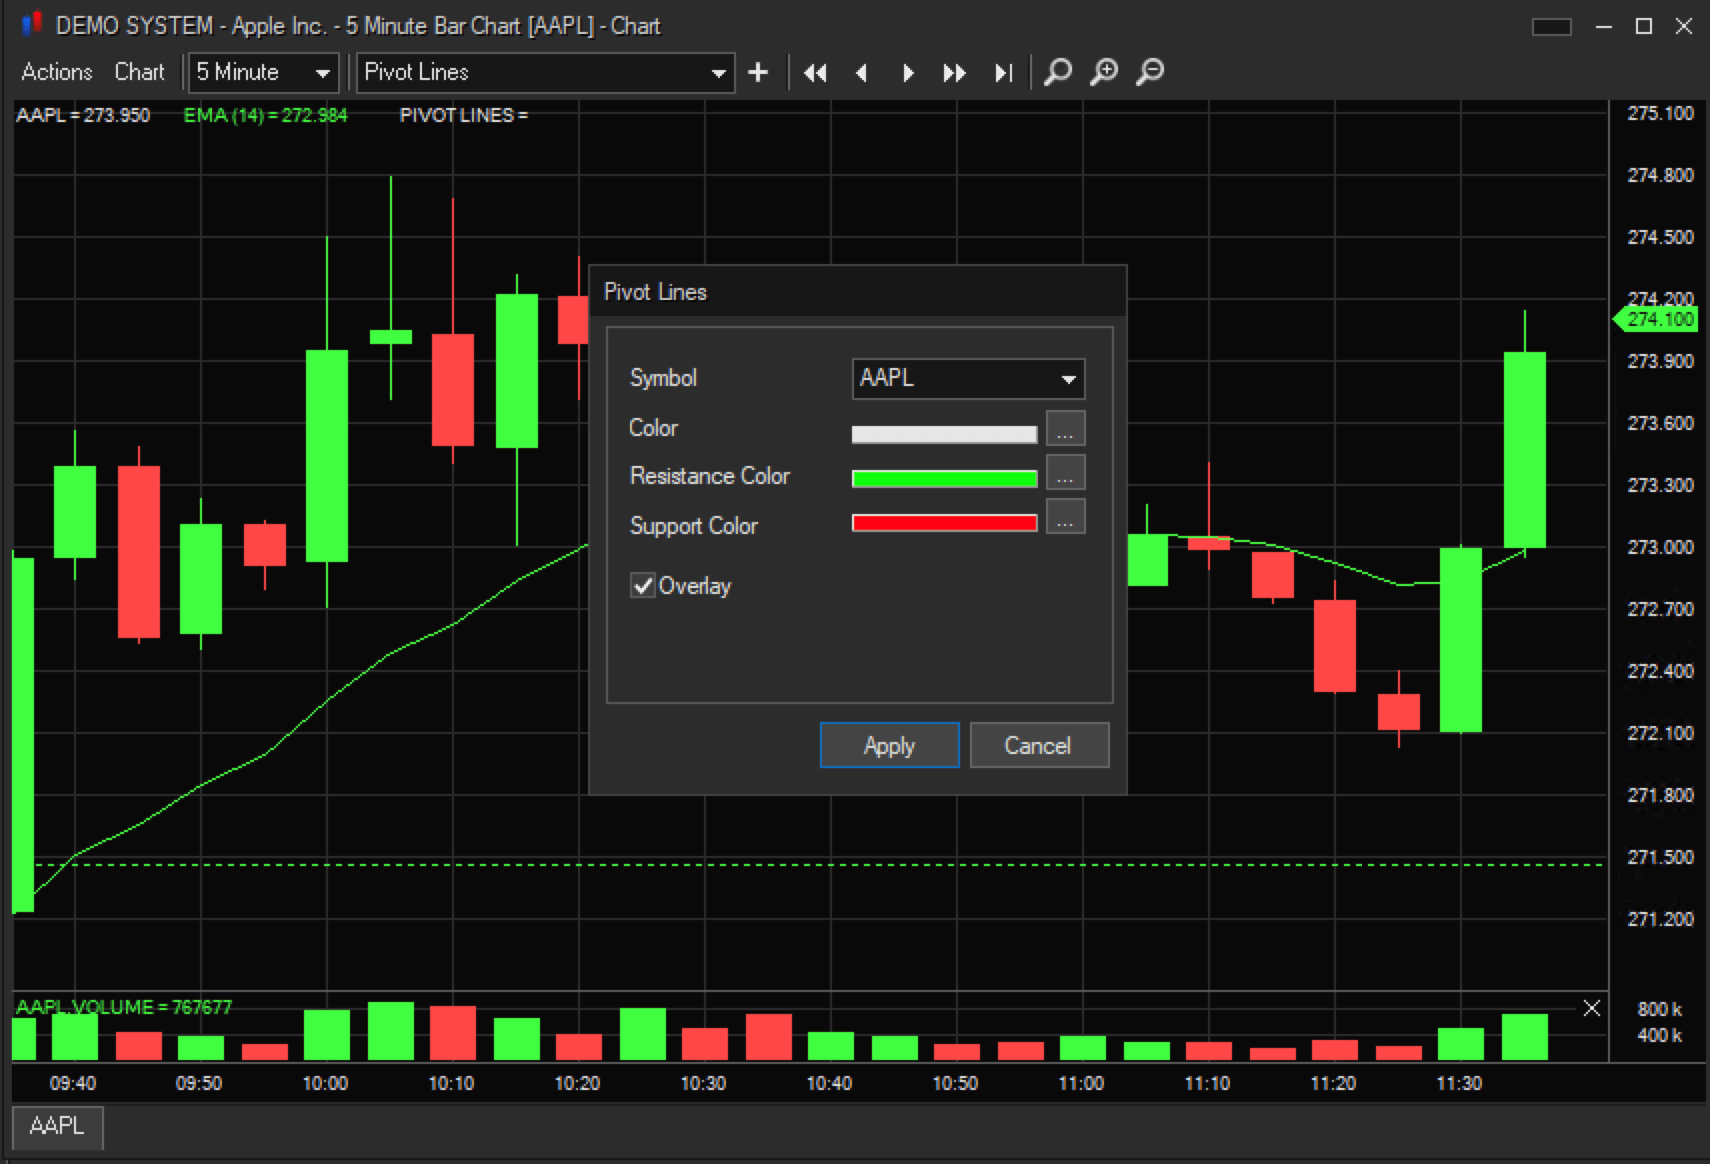
The default Pivot Line Color is White.
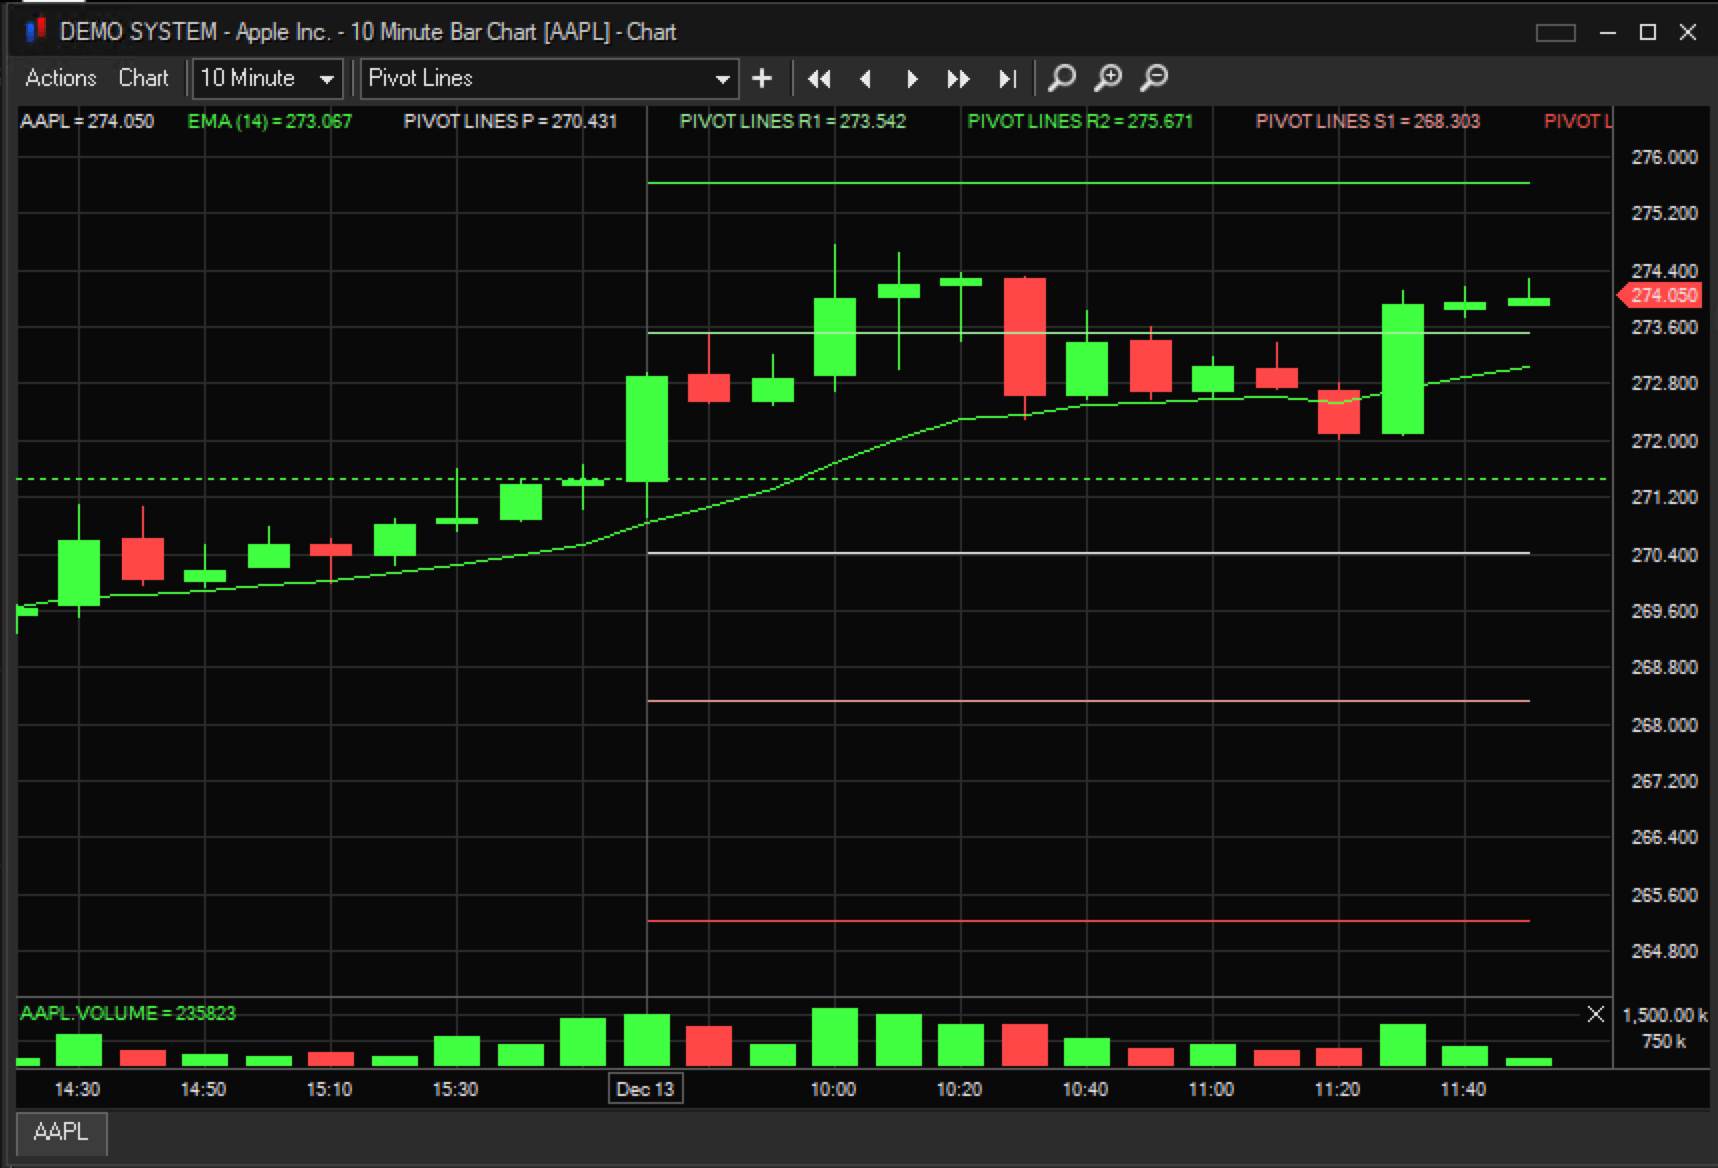
The white line is the pivot line, with the two lines above being levels of Support (S1, S2) and the two lines below being levels of Resistance (R1, R2)
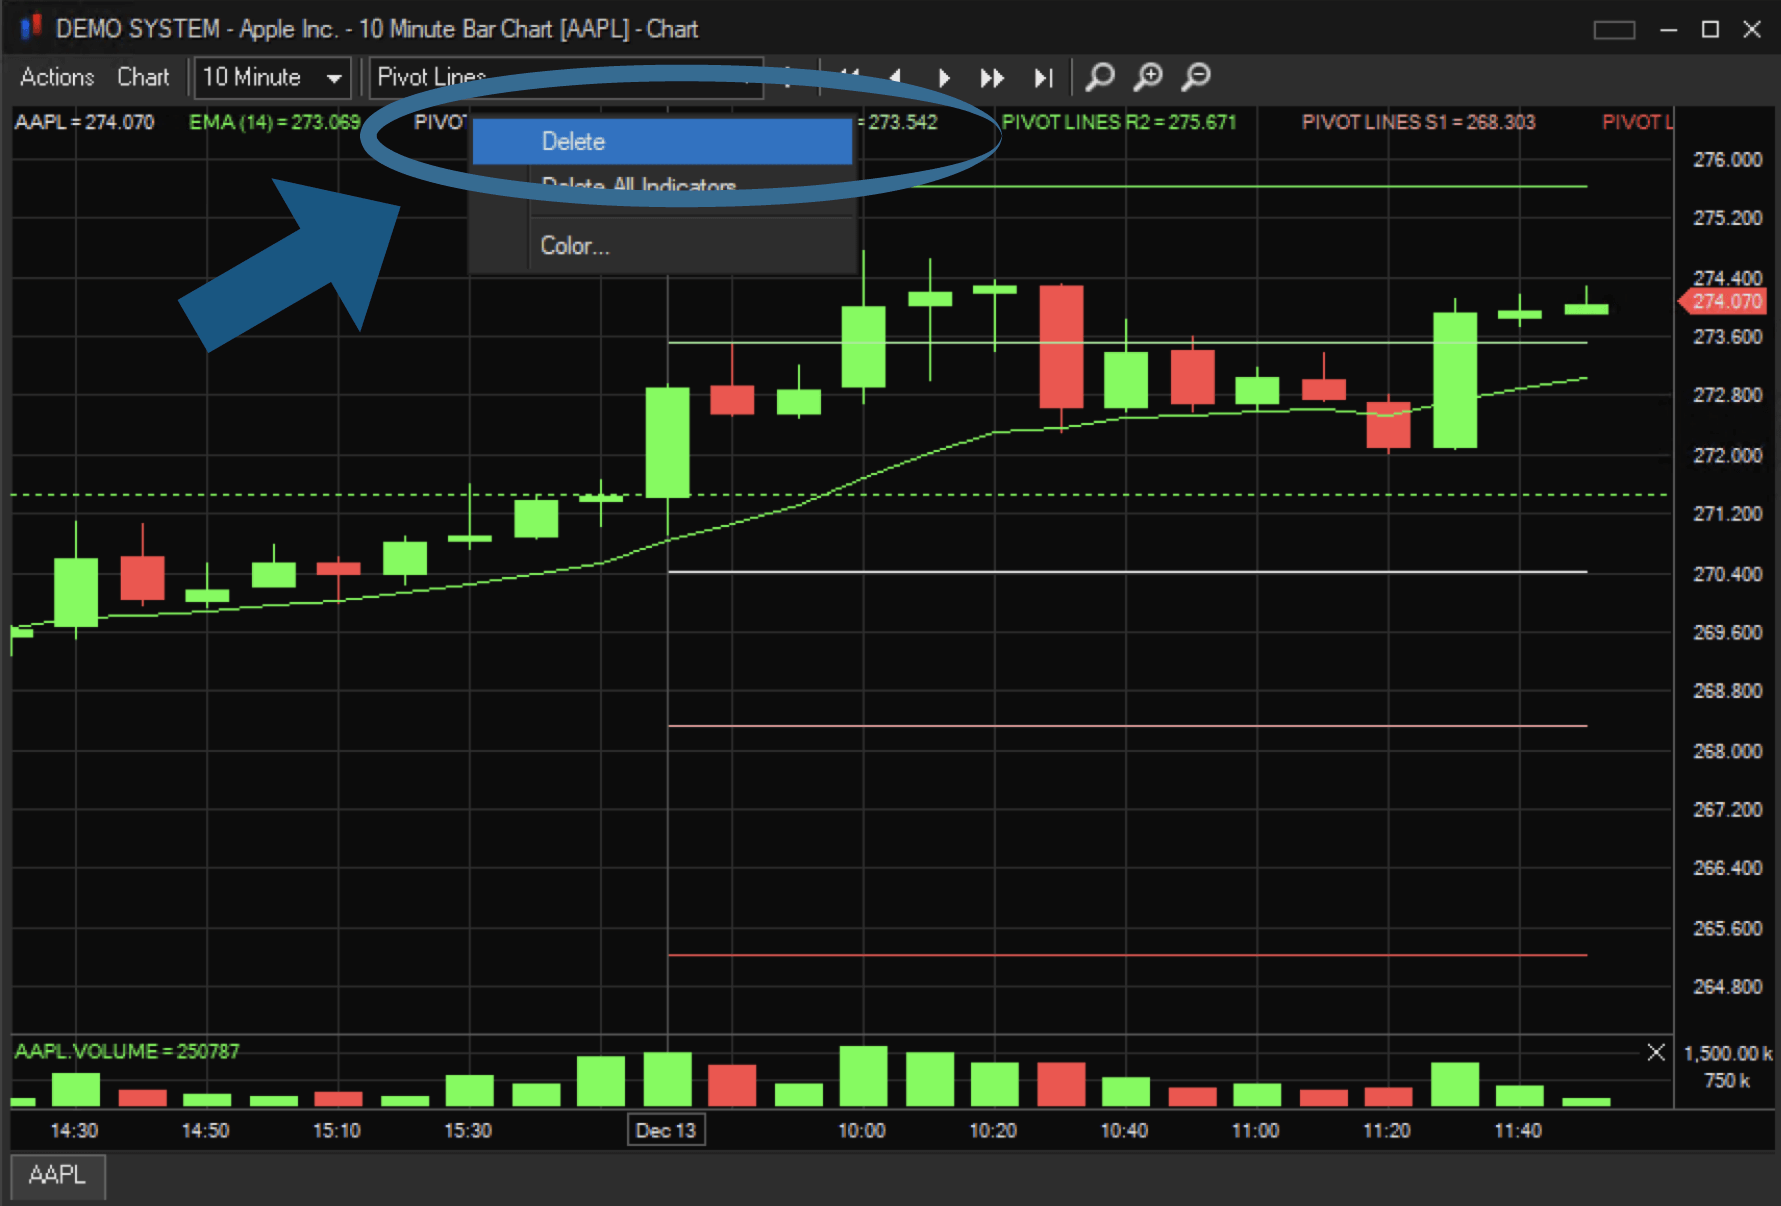
To delete any study, right-click on the study at the top of the chart.
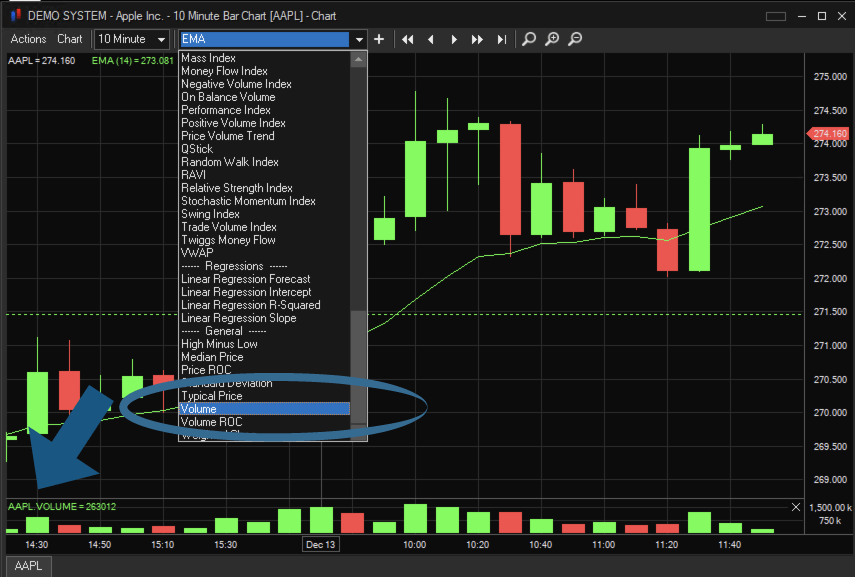
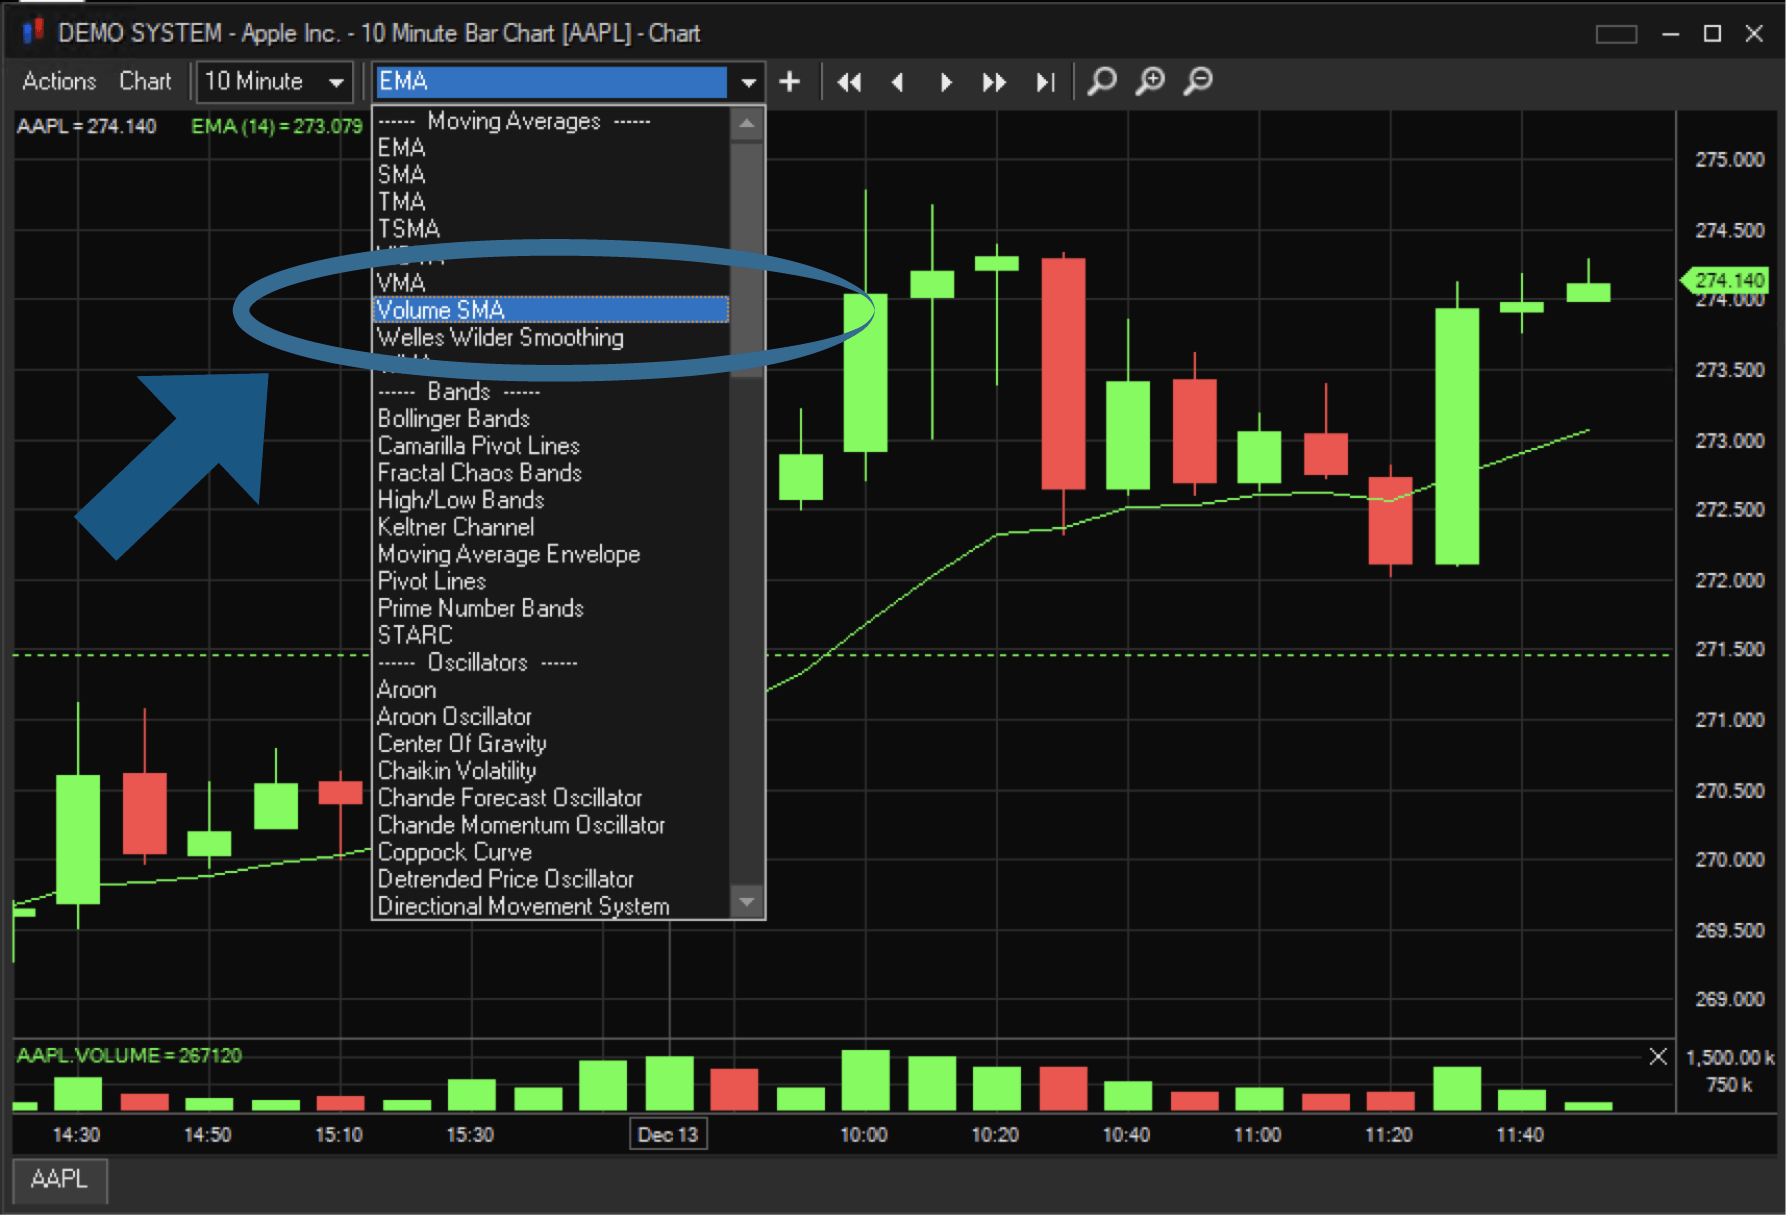
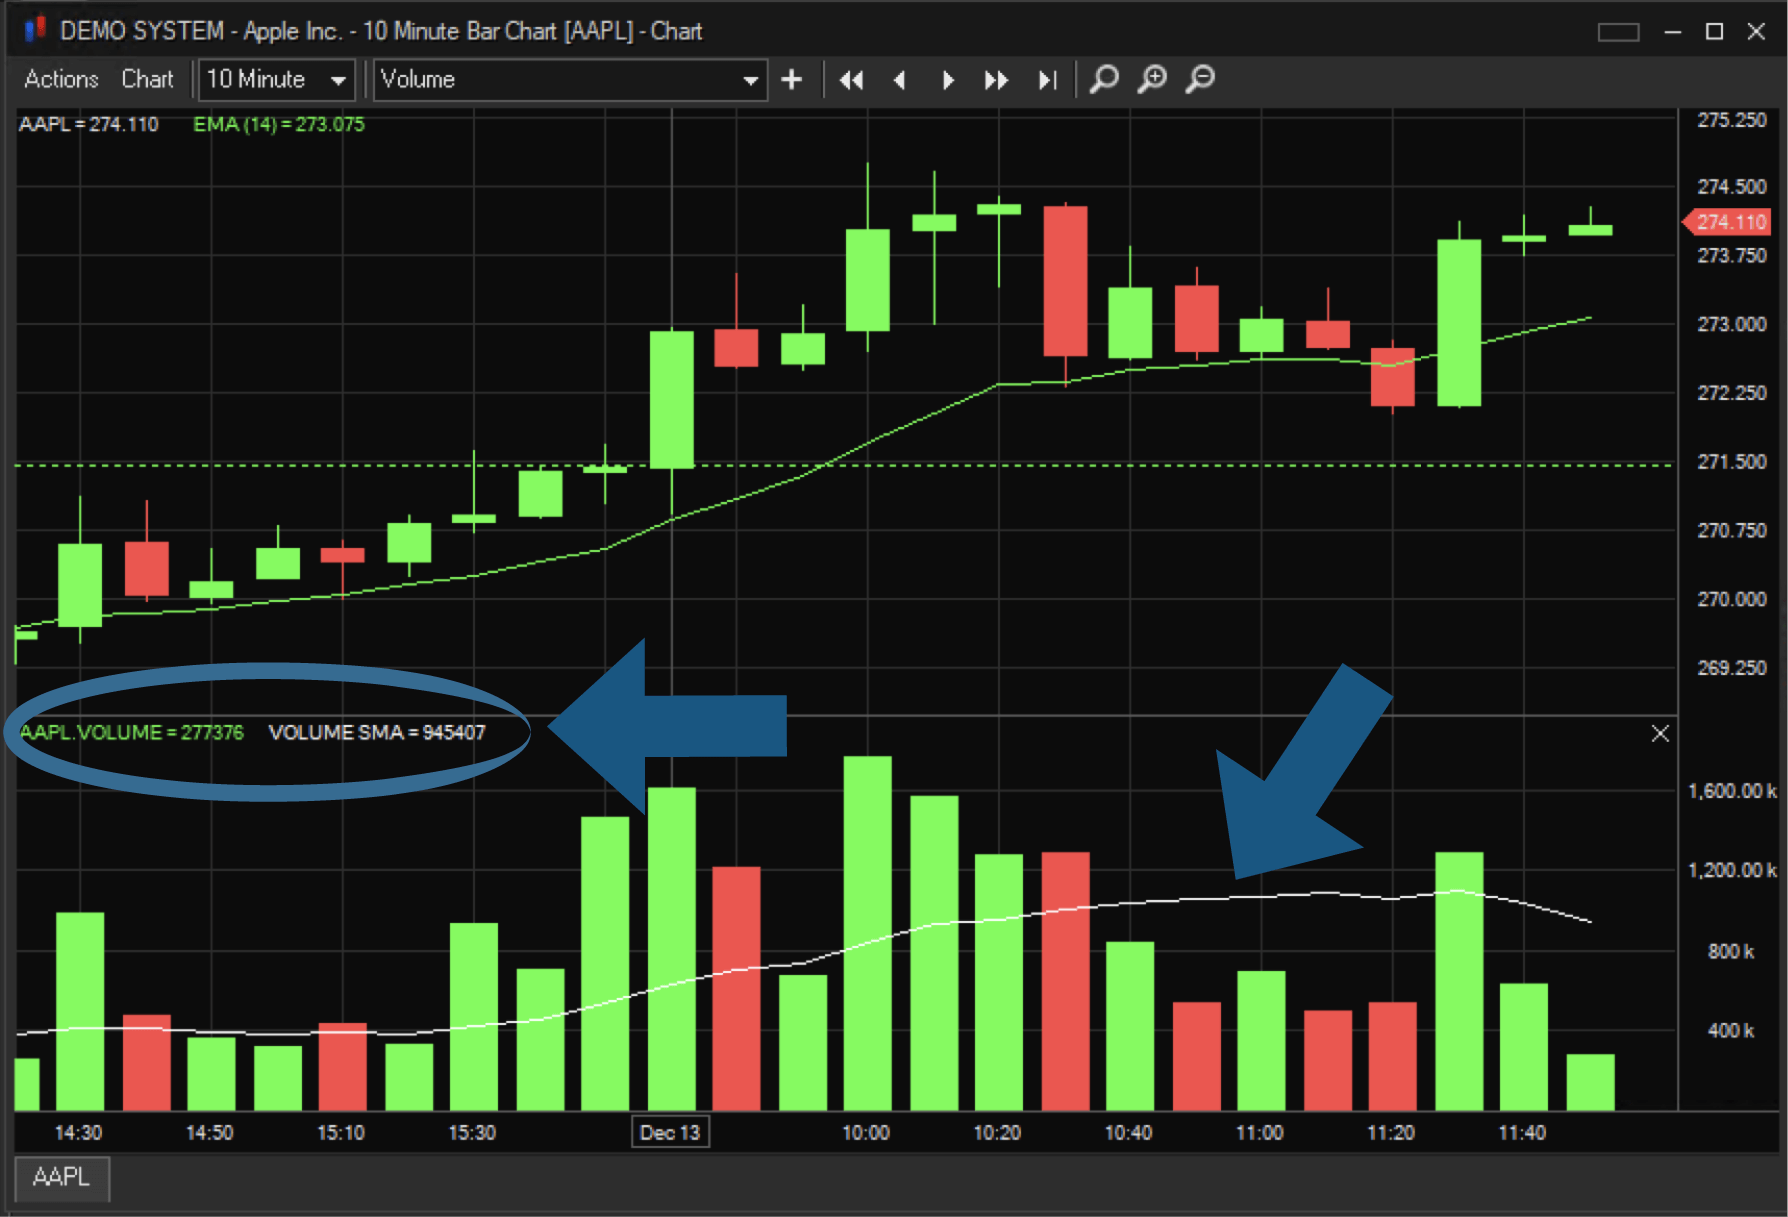
Next, add a Volume SMA onto the volume study.
The Simple Moving Average (SMA) is calculated by adding the price of an instrument over a number of time periods and then dividing the sum by the number of time periods. The SMA is basically the average price of the given time period, with equal weighting given to the price of each period. This is shown in the white line below.
We look forward to learning more about your trading needs.
Sterling Trading Tech Implements Revised FINRA Rule 4210 for Lightspeed Financial
PDT Rule Now Eliminated and Replaced with New Intraday Margin Sterling Immediately Ready to ...

Modernizing Margin | FINRA Publishes New Rule 4210 Interpretations as the Industry Prepares for Real-Time Risk Management
This blog is part of Sterling Trading Tech's Modernizing Margin series examining the ...

PropShop Chooses Sterling OMS 360 to Advance Equities Trading Capabilities
PropShop selected Sterling to support its expansion into equities as a second asset class ...

The Market Isn't Telling You Which Way It's Going. It's Telling You It Doesn't Know Either.
A surge in put activity is not a directional call. It's evidence of a divided market — and ...